Is now the best time to sign a lease for an apartment in Boston? With rent prices climbing and availability shifting, timing your rental search could save thousands annually. Boston’s rental market has unique rhythms, influenced by seasonal demand and economic factors. This blog breaks down the key considerations for signing a lease in Boston—from analyzing market trends to decoding lease terms—to help you make an informed decision.
Table of Contents
- Boston’s Rental Market: Current Trends
- Seasonal Demand: When Prices Peak
- Neighborhood Guide: Where to Look
- Understanding Lease Terms
- Financial Considerations
- How Boston Pads Simplifies Your Search
Boston’s Rental Market: Current Trends
Boston’s Real-Time Availability Rate (RTAR) stands at 4.36%, up 17.52% from last year, suggesting more options for renters. However, competition remains tight: the median days on market for apartments dropped to 20 days, 16 days faster than last year. Average rent hit $3,303, a 10.88% increase over two years.
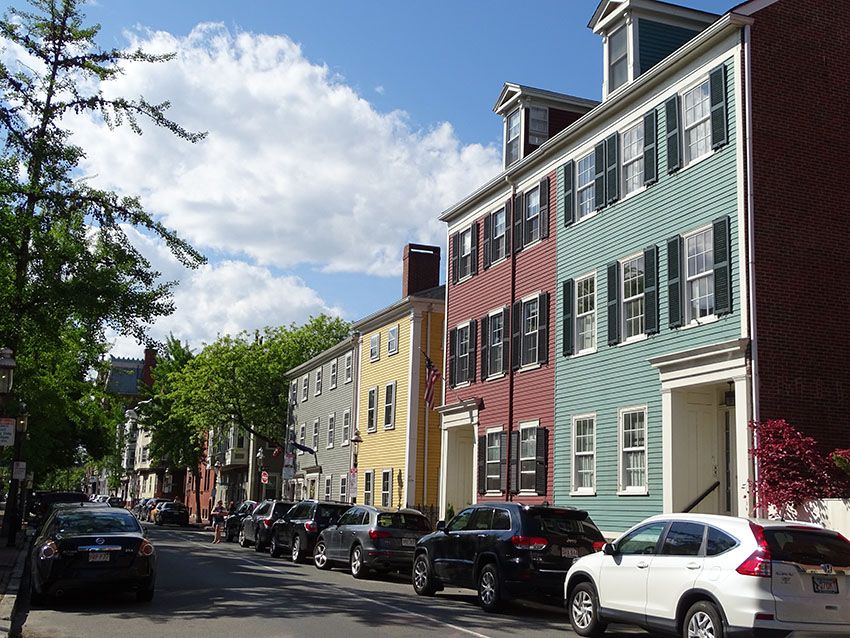
Apartments for rent in Boston vary widely by neighborhood. Back Bay and South End command premium prices ($3,500+ for 1-bedrooms), while areas like Dorchester and Roxbury offer more affordable options ($2,200–$2,800). The Real-Time Vacancy Rate (RTVR) in Boston is 1.03%, up 71.67% year-over-year, signaling slightly more flexibility for renters. Overall, Boston is failing at delivering new apartment supply primarily due to high affordability requirements in new development and outdated zoning codes.
Seasonal Demand: When Prices Peak
Boston’s rental market follows predictable seasonal patterns:
- September Surge: Prices tend to peak during September 1st – August 31st fixed term leasing cycle.
- Winter Dip: Lower demand from November–February can mean approximately 5% price drops.
- Spring Stability: March–June sees moderate demand and stable pricing.
For example, signing a lease in December 2023 could have saved renters $150–$300/month compared to September rates, based on Boston Pads’ historical data. Keep in mind that most landlords and property managers tend to prefer getting their units back on the dominant 9/1 – 8/31 leasing cycle. So expect the possibility of a shorter or bifurcated lease with a rent increase that following 9/1.
Neighborhood Guide: Where to Look
|
Neighborhood |
Avg. 1-Bed Rent |
RTAR |
|
Back Bay |
$3,800 |
2.09% |
|
Brighton |
$2,900 |
2.60% |
|
Dorchester |
$2,400 |
5.10% |
|
South End |
$3,600 |
1.80% |
The Greater Boston Area offers slightly lower rents ($3,247 average vs. Boston’s $3,303), with higher RTAR (3.90%) for more options.
Understanding Lease Terms
Key lease clauses to scrutinize:
- Rent Increases: 53% of Boston leases have annual increases (2–5%).
- Broker Fees: 87.17% of landlords don’t pay broker fees, but verify terms. This number can vary widely between vacant units and occupied units coming up for rent. Vacant units usually have far more incentivized fee structures.
The Federal Housing Administration (FHA) doesn’t regulate leases directly, but Massachusetts law requires landlords to disclose lead paint risks in pre-1978 buildings.
Financial Considerations
- Upfront Costs: First/last month’s rent + security deposit (typically $6,600–$9,900 for a $3,300 apartment).
- Utilities: Average $150–$300/month for heating (critical in Boston winters).
- Renter’s Insurance: $15–$30/month—recommended by 68% of Boston landlords.
Pro Tip: Use the 30% rule—keep rent under 30% of gross income. For Boston’s $3,303 average rent, this requires a $132,120 annual household income.
Apartments in Boston: How Boston Pads Helps
Finding the perfect apartment in Boston can be a daunting task, especially in a competitive market. However, with the right tools and resources, you can streamline your search and secure a great rental property. Boston Pads offers a comprehensive suite of features designed to simplify the rental process for both renters and landlords.
Boston Pads streamlines the rental process with:
- Real-Time Listings: Updated availability for 214,909 properties, including 3,311 non-luxury units. This extensive database ensures that you have access to the most current listings, giving you a competitive edge in finding your ideal apartment.
- Fee Transparency: Filter listings by broker fee terms. This feature helps you avoid unexpected costs and focus on properties that fit your budget.
- Market Analytics: Track Real-Time Availability Rate (RTAR) and Real-Time Vacancy Rate (RTVR) trends to time your search optimally. By understanding these market dynamics, you can identify the best times to rent and negotiate more effectively.
For example, Boston Pads’ data shows that many winter applicants can save 7–12% on rent compared to fall movers. Additionally, landlords using Boston Pads reduce vacancy periods by 22% through targeted pricing tools, which can lead to faster and more efficient rentals for both parties. This combination of real-time data and strategic tools empowers renters to make informed decisions and secure the best possible rentals in Boston.
Making the Final Call!
Signing a lease in Boston requires balancing market timing, neighborhood priorities, and budget constraints. While September brings peak demand, winter months offer better deals and flexibility. Tools like Boston Pads provide real-time data and search filters to streamline the process, whether you’re eyeing a Back Bay brownstone or a Brighton studio. By understanding seasonal trends and lease terms, you can secure a rental that aligns with your lifestyle and financial goals.
Sources:
- Boston Pads Rental Market Report (2024)
- Greater Boston Real Estate Board (2023)
- Massachusetts Rental Housing Association Seasonal Trends Study (2023)
- Boston Tenant Coalition Lease Analysis (2023)
- Massachusetts General Law Chapter 111, Section 199A National Association of Insurance Commissioners (2023)


