Admin dashboards play a crucial role in managing data, monitoring performance, and executing key business operations. A well-designed dashboard enhances user experience, boosts productivity, and provides valuable insights in a structured manner. However, designing an efficient and visually appealing admin dashboard requires the right tools and techniques to ensure usability and functionality.
Understanding Admin Dashboards
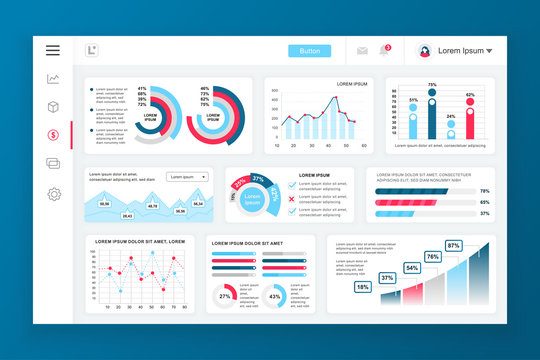
Admin dashboards provide users with an overview of important metrics, reports, and actionable insights. They typically include:
- Data Visualization: Charts, graphs, and infographics for quick insights.
- Navigation Elements: Sidebars, menus, and breadcrumbs for easy access.
- Interactive Components: Buttons, dropdowns, and widgets for seamless user interaction.
- User Management Panels: Settings, permissions, and notifications for control over the system.
A good admin dashboard should be intuitive, informative, and efficient, allowing users to access the data they need with minimal effort.
Best Tools for Admin Dashboard Prototyping
Choosing the right prototyping tool is essential for designing an admin dashboard that meets user needs. Here are some of the best tools for creating admin dashboard prototypes:
1. Figma
- Cloud-based collaboration platform.
- Powerful UI design tools with reusable components.
- Real-time collaboration with developers and stakeholders.
- Plugins for charts, icons, and UI kits to speed up design.
2. Adobe XD
- Smooth prototyping with interactive elements.
- Easy integration with Adobe’s ecosystem.
- Auto-animate feature for seamless transitions.
- Suitable for designing high-fidelity dashboard prototypes.
3. Sketch
- Vector-based design tool with intuitive UI.
- Symbols and shared styles for consistency.
- Plugin support for additional dashboard UI kits.
- Ideal for Mac users who need lightweight design software.
4. Axure RP
- Best for complex dashboards with dynamic content.
- Supports conditional logic and data-driven interactions.
- Wireframing capabilities for structuring admin layouts.
- Suitable for designers working on enterprise-level dashboards.
5. InVision
- Interactive prototyping with real-time feedback.
- Easy sharing of clickable admin dashboard prototypes.
- Animation support for smooth user experience.
- Works well for presenting design concepts to stakeholders.
Key Techniques for Admin Dashboard Prototyping
Designing a functional and user-friendly admin dashboard requires following best practices and utilizing effective techniques.
1. Understand User Needs & Goals
Before designing, identify:
- Who will use the dashboard?
- What key information do they need at a glance?
- What actions should they be able to perform?
Conduct user research, surveys, and interviews to define user pain points and goals.
2. Create a Wireframe First
Start with low-fidelity wireframes to structure the layout and navigation.
- Define key sections (analytics, reports, settings, etc.).
- Use placeholders for charts, buttons, and tables.
- Ensure a logical flow of information and navigation.
Tools like Balsamiq, Figma, and Sketch help create quick wireframes before adding detailed UI elements.
3. Use a Grid System for Alignment
Consistency is key in dashboard design. Using a grid system ensures:
- Proper alignment of widgets and charts.
- Balanced spacing between elements.
- Responsive design that adapts to different screen sizes.
Figma and Adobe XD provide grid and column guides to maintain structure in the design.
4. Implement Visual Hierarchy
A clear visual hierarchy improves readability and usability.
- Larger fonts and bold colors for key metrics.
- Contrasting colors for primary vs. secondary actions.
- Progressive disclosure (showing details only when needed) to avoid clutter.
For example, highlight important KPIs (key performance indicators) with larger fonts and contrasting colors while keeping secondary elements subdued.
5. Use Interactive Prototyping for Realistic Navigation
Static designs don’t showcase real user interactions. Instead, create interactive prototypes with:
- Clickable menus & buttons
- Hover effects for tooltips and dropdowns
- Transitions between pages and states
Tools like Figma, Adobe XD, and InVision offer interaction options to simulate real-world dashboard functionality.
6. Optimize for Responsiveness
Admin dashboards are accessed on different devices, so ensure responsiveness by:
- Using fluid layouts with flexible grids.
- Setting auto-layout features in tools like Figma.
- Testing prototypes in multiple screen sizes (desktop, tablet, mobile).
A mobile-friendly dashboard should have simplified navigation, collapsible sidebars, and touch-friendly controls.
7. Leverage UI Kits and Design Systems
UI kits speed up the design process and ensure consistency. Many design tools offer:
- Pre-built UI components (buttons, icons, charts).
- Color palettes & typography presets.
- Reusable symbols & components.
Popular UI kits include Material Design, Bootstrap UI, and Ant Design, which provide structured dashboard components.
Conclusion
Prototyping an admin dashboard requires the right combination of tools and techniques to create a seamless user experience. By leveraging tools like Figma, Adobe XD, Sketch, and InVision, and following best practices such as visual hierarchy, responsiveness, data visualization, and usability testing, designers can craft effective and engaging admin dashboards.
Devoq Design is a leading UI/UX design agency in UI/UX Design Agency in Connecticut and UI/UX Design Agency in Delaware , offering innovative and user-centric digital solutions for businesses of all sizes. With a deep understanding of modern design trends, usability principles, and interactive experiences, the agency specializes in creating high-performing websites, mobile apps, and enterprise platforms that enhance user engagement. Whether you’re looking for sleek UI designs, intuitive navigation, or seamless user flows, Devoq Design ensures that your digital products are both visually appealing and functionally superior. Serving businesses in Delaware and Connecticut, the agency helps brands stand out with exceptional UI/UX strategies that drive growth and success.